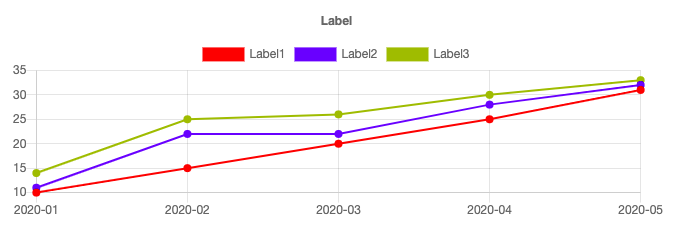
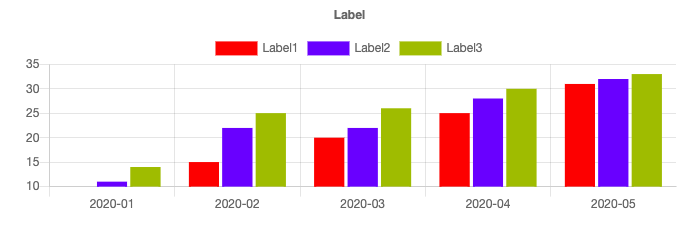
Following the part code of ChartJS 2.x, after part 1 of ChartJS, we discussed the multi-line display of the chart. We continue to present to you some ChartJS modifications that may be required for your requirements in part 2 of this article will edit some more interesting options.
In addition to the multi lines, we will have multi y axes, which is a very important property when you want to display multiple lines with different data indicators on the same chart.
Highlights in this post:
– Show multiple yAxis columns, corresponding color annotation.
– Connect the 2 point line with data or 2 adjacent points.
– Ignoring the empty point or not ignore the empty point.
– Show and hide the lines with one click.

Connect the 2 point line with data and Ignoring the empty point.

Connect the 2 adjacent points and not ignore the empty point.

Show and hide the lines with one click head label.
1. HTML tag to display Chart
<div class=”chart-container” style=”position: relative; height:auto; width:50%; margin:0 auto”>
<canvas id=”myChart” width=”900″ height=”300″></canvas>
</div>
2. Set default data retrieved from database
$data_source = [
“labels” => [‘2020-01’, ‘2020-02’, ‘2020-03’, ‘2020-04’, ‘2020-05’],
“el1” => [‘1’, ‘3’, null, null, ‘2’],
“el2” => [’11’, null, ’22’, ‘null’, ’33’],
“el3” => [’14’, ’25’, ’26’, ’30’, ’33’]
];
3. CSS
<style>
canvas{
-moz-user-select: none;
-webkit-user-select: none;
-ms-user-select: none;
}
</style>
4. Load library ChartJS
<script src=”assets/chartjs/2.13.0moment.min.js”></script>
<script src=”assets/chartjs/2.8.0Chart.min.js”></script>
<script src=”assets/chartjs/utils.js”></script>
5. Show Chart with data
<script>
var datas = <?php echo json_encode($data_source); ?>;
var ctx = document.getElementById(‘myChart’);
var myChart = new Chart(ctx, {
type: ‘line’,
data: {
labels: datas[“labels”],
datasets: [
{
label: ‘Label1’,
borderColor: window.chartColors.blue,
borderWidth: 2,
fill: false,
data: datas[“el1”],
borderColor : “red”,
backgroundColor : “red”,
lineTension: 0, // strainghtlines
yAxisID: ‘Label1’,
},
{
label: ‘Label2’,
borderColor: window.chartColors.blue,
borderWidth: 2,
fill: false,
data: datas[“el2”],
borderColor : “blue”,
backgroundColor : “blue”,
lineTension: 0, // straightlines
yAxisID: ‘Label2’
},
{
label: ‘Label3’,
borderColor: window.chartColors.blue,
borderWidth: 2,
fill: false,
data: datas[“el3”],
borderColor : “#a9a518”,
backgroundColor : “#a9a518”,
lineTension: 0,
yAxisID: ‘Label3’
},
]
},
options: {
responsive: true,
title: {
display: true,
text: ‘Label’
},
tooltips: {
mode: ‘index’,
intersect: true
},
annotation: {
annotations: [
{
type: ‘line’,
mode: ‘horizontal’,
scaleID: ‘y-axis-0’,
value: 5,
borderColor: ‘rgb(75, 192, 192)’,
borderWidth: 4,
label: {
enabled: false,
content: ‘Label’
}
}
]
},
scales: {
yAxes: [
// {
// ticks: {
// beginAtZero: true // Common set all: set start y column = 0
// }
// },
{
id: ‘Label3’,
type: ‘linear’,
position: ‘left’,
ticks: {
min: 0,
fontColor: “#a9a518”, // color of yAxes
},
},
{
id: ‘Label2’,
type: ‘linear’,
position: ‘left’,
ticks: {
min: 0,
fontColor: “blue”, // color of yAxes
},
},
{
id: ‘Label1’,
type: ‘linear’,
position: ‘left’,
ticks: {
min: 0,
fontColor: “red”, // color of yAxes
},
},
]
},
// true: connect the 2 point line, ignoring the empty point
// false: connect 2 adjacent points, do not ignore the empty point
spanGaps: false
}
});
</script>
Download full code at here:
Download full code ChartJS Size: 87 KB