Hiển thị các bài đăng có nhãn jquery. Hiển thị tất cả bài đăng

Thứ Ba, 25 tháng 1, 2022

Get Football ranking table with free API

 For sports fans it is common to follow the matches, update results, standings and player information. There are many websites, APIs that give us such data.

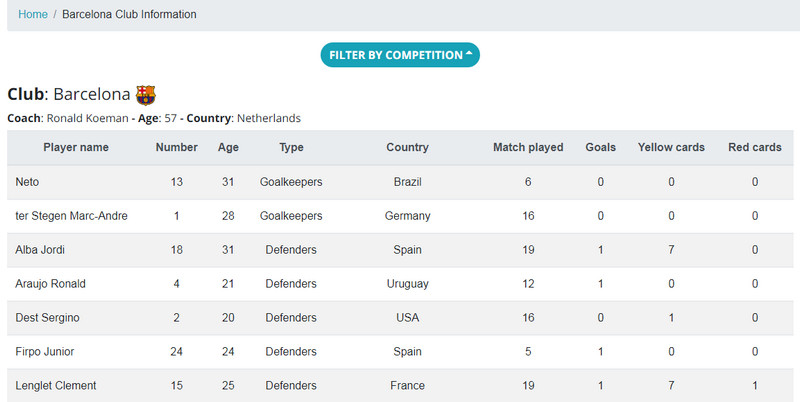
However, today I would like to introduce how to get the rankings, top football leagues by free api on apifootball.com, the results are shown below. Just get and display them on your website.


148-England-Premier-League

England-Premier-League (leagueId is 148)


We use Laravel with VueJS to do this.

1. Route:

The first is the route definition

// Route get rankings by tournament
Route::get(‘/standings/{leagueId}’, ‘Sport\FootballController@standings’);

// Route get team information in a tournament
Route::get(‘/teams/{leagueId}/{team_id}’, ‘Sport\FootballController@getTeams’);

// Route retrieves player details
Route::get(‘/players/{team_key}/{player_name}’, ‘Sport\FootballController@getPlayers’);

2. Controller

You need to register an API on the apifootball.com page, after having this API key, we use it to get data through the controller.

register-your-api-football

Your API


IDs of the tournaments (league_id), will be provided here: https://apifootball.com/coverage/


ids-of-the-tournaments

IDs of the tournaments (league_id)


The three functions in the controller have the following meanings:

– standings($leagueId): Ranking of a tournament.
– getTeams($league_id, $team_id): Team information in a tournament.
– getPlayers($team_key, $player_name): Details of players on the team.


In the FootballController file: App\Http\Controllers\Api\Sport

namespace App\Http\Controllers\Api\Sport;

use Illuminate\Http\Request;
use App\Http\Controllers\Controller;

class FootballController extends Controller
{
private $api_key;

public function __construct($api_key = ‘YOUR_API_KEY’)
{
$this->api_key = $api_key;
}

public function standings($leagueId)
{
$APIkey = $this->api_key;
$curl_options = array(
CURLOPT_URL => “https://apiv2.apifootball.com/?action=get_standings&league_id=$leagueId&APIkey=$APIkey”,

CURLOPT_RETURNTRANSFER => true,
CURLOPT_HEADER => false,
CURLOPT_TIMEOUT => 30,
CURLOPT_CONNECTTIMEOUT => 5
);

$curl = curl_init();
curl_setopt_array( $curl, $curl_options );
$result = curl_exec( $curl );
$result = (array) json_decode($result);

return $result;
}

public function getTeams(Request $request, $league_id, $team_id)
{
// Because the code is quite long, I will put it in the download file at the bottom of the page
}

public function getPlayers(Request $request, $team_key, $player_name)
{
// Because the code is quite long, I will put it in the download file at the bottom of the page
}
}


3. VueJS

– In the app.js file: resource/js/app.js

require(‘./bootstrap’);

import Vue from ‘vue’;
import VueRouter from ‘vue-router’;

Vue.use(VueRouter);

import App from ‘./views/App’

// Fooball
import Standing from ‘./components/Football/StandingTable’;
import GetTeams from ‘./components/Football/GetTeams’;
import GetPlayers from ‘./components/Football/GetPlayers’;

const router = new VueRouter({
mode: ‘history’,
routes: [
{
path: ‘/’,
name: ‘home’,
component: Home
},
{
path: ‘/standings/:leagueId’,
name: ‘fb.standing’,
component: Standing
},
{
path: ‘/teams/:leagueId/:team_id’,
name: ‘fb.getTeams’,
component: GetTeams
},
{
path: ‘/players/:team_key/:player_name’,
name: ‘fb.getPlayers’,
component: GetPlayers
},

// …
],

});

const app = new Vue({
el: ‘#app’,
components: { App, Datepicker },
router,
});

– In the StandingTable.vue file: resource/js/components/Football/StandingTable.vue
// Because the code is quite long, I will put it in the download file at the bottom of the page

– In the GetTeams file: resource/js/components/Football/GetTeams.vue
// Because the code is quite long, I will put it in the download file at the bottom of the page

– In the GetPlayers file: resource/js/components/Football/GetPlayers.vue
// Because the code is quite long, I will put it in the download file at the bottom of the page

First I assume you pass leagueId = 148 (England – Premier League) which will be as shown above.

With leagueId = 468 (LaLiga), we will see the following.


468-LaLiga

LaLiga (leagueId id 468)


– Click View Detail to view detailed information.


barcenola-team-detail

Barcenola team detail


Reference links: https://popularinfo.net/standings/148

Wish you success with this free API, Laravel and VueJS thanks for reading the article.


Download full code: Download Size: 6 KB


Chủ Nhật, 23 tháng 1, 2022

Frontend form validation with VueJS

Hello everyone, in all forms such as login, registration or checking information, etc. In Frontend we need to validate the data for it before it is processed in the backend and saved to the Database.

Checking data in Frontend form using VueJS is a way to greatly reduce time compared to when you check data in the backend.

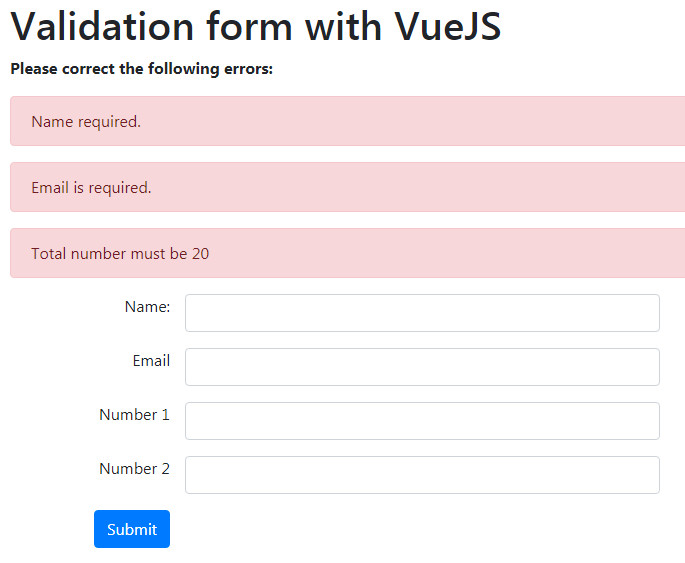
In this example, we will validation the data of the most basic components, which are required to enter textbox, email, number and value of total number.


frontend-form-validation-with VueJS

Frontend form validation with VueJS


1. VueJS and Bootstrap

If you have not installed VueJS and bootstrap, please call the library as below:

<script src=”https://cdn.jsdelivr.net/npm/vue/dist/vue.js”></script>

<link rel=”stylesheet” href=”https://maxcdn.bootstrapcdn.com/bootstrap/4.0.0/css/bootstrap.min.css”>


2. The HTML form tags are as follows:

– error: Displayed if there are errors.length > 0

– How to declare v-model can be used one of two ways (for example at position Number 1)

     <div class=”container”>
<h1>Validation form with VueJS</h1>
<form action=”/” method=”POST” @submit=”checkForm” novalidate=”true” id=”app”>
<div v-if=”errors.length”>
<p><b>Please correct the following errors: </b></p>
<div class=”flash-message” v-for=”error in errors”>
<p class=”alert alert-danger”>{{ error }}</p>
</div>
</div>
<div class=”form-group”>
<div class=”row”>
<label for=”name” class=”col-md-2 text-right”>Name:</label>
<input type=”text” name=”name” v-model=”name” class=”form-control col-md-5″ />
</div>
</div>
<div class=”form-group”>
<div class=”row”>
<label for=”email” class=”col-md-2 text-right”>Email</label>
<input type=”email” name=”email” v-model=”email” class=”form-control col-md-5″ />
</div>
</div>
<div class=”form-group”>
<div class=”row”>
<label for=”number1″ class=”col-md-2 text-right”>Number 1</label>
<!– <input type=”number” v-model=”number1″ min=”0″/> v-model or v-model.number –>
<input type=”number” v-model.number=”number1″ min=”0″ class=”form-control col-md-5″ />
</div>
</div>
<div class=”form-group”>
<div class=”row”>
<label for=”number2″ class=”col-md-2 text-right”>Number 2</label>
<input type=”number” v-model=”number2″ min=”0″ class=”form-control col-md-5″ />
</div>
</div>
<div class=”form-group”>
<div class=”row”>
<div class=”col-md-2 text-right”>
<button type=”submit” class=”btn btn-primary”>Submit</button>
</div>
</div>
</div>
</form>
</div>


3. Script to handle validate

– el: ‘app’ is the form submit ID

– total: The processing function calculates the sum

– checkForm: The checkForm function executes before the form is submitted

– validEmail: Check that the entered value is in the correct email format


const app = new Vue({
el: ‘#app’,
data: {
errors: [],
name: null,
email: null,
number1: null,
number2: null
},
computed: {
total: function() {
return Number(this.number1) + Number(this.number2);
}
},
methods: {
checkForm: function(e) {
this.errors = [];
if (!this.name) {
this.errors.push(‘Name required.’);
}
if (!this.email) {
this.errors.push(‘Email is required.’);
} else if (!this.validEmail(this.email)) {
this.errors.push(‘Email is not validate’);
}
if (this.number < 0) {
this.errors.push(‘Number must unsinged’);
}
if (this.total != 20) {
this.errors.push(‘Total number must be 20’);
}
if (!this.errors.length) return true;
e.preventDefault();

},
validEmail:function(email) {
var re = /^(([^<>()\[\]\\.,;:\s@”]+(\.[^<>()\[\]\\.,;:\s@”]+)*)|(“.+”))@((\[[0-9]{1,3}\.[0-9]{1,3}\.[0-9]{1,3}\.[0-9]{1,3}\])|(([a-zA-Z\-0-9]+\.)+[a-zA-Z]{2,}))$/;
return re.test(email);
}
}
});

Thứ Tư, 19 tháng 1, 2022

Simple example for VueJS Search Filter

Search is an extremely important component in every website that contains many categories and components. Especially the site about e-commerce, blog, news, etc. All need the search function to select information.

This article applies to the quick search of data in the array that is returned as soon as you enter your search keywords, below I have written how to call the API that returns the datas array and assuming an array datas is available.


simple-example-for-vueis-search-filter

Simple example for VueJS Search Filter


First, we assume that there is an API that returns data, including post title and article category name:

datas: [
{ title:”Add weather and time zone information to your website from free API”, category:”VueJS” },
{ title:”How to import data from excel file, csv into the database and export back”, category:”PHP-MySQL” },
{ title:”PHP – MVC CRUD and Connect to MySQL using PDO”, category:”PHP-MySQL” },
{ title:”Automatically backup MySQL database with Batch file on Windows”, category:”PHP-MySQL” },
{ title:”Add and Remove input textbox with Jquery, Javascript”, category:”Jquery-Javascript” },
{ title:”Customizable multi-type, multi-y axis code ChartJS – Part 2″, category:”Jquery-Javascript” },
{ title:”Customizable multi-type, multi-y axis code ChartJS – Part 1″, category:”Jquery-Javascript” },
];


If you have VueJS installed, that’s great, but just want to test quickly without installation, add the VueJS library as below, and add Bootstrap to use it.

<script src=”https://cdn.jsdelivr.net/npm/vue@2.6.12″></script>
<link rel=”stylesheet” href=”https://maxcdn.bootstrapcdn.com/bootstrap/4.0.0/css/bootstrap.min.css”>

About template.vue

– You need an input box to enter the keyword search, a loading icon shows the time it takes to show dataư

– resultQuery: If there is datas, the data will be retrieved in the for loop

<template>
<div class=”col-md-12 text-center”>
<div class=”col-md-4 p-0″>
<input type=”text” v-model=”quickSearch” placeholder=”Quick search…” class=”form-control”>
</div>
<p v-if=”loading” class=”text-center”><img :src=”‘https://softdownloadfree.com/uploads/images/loading-icon.gif'” alt=”loading” width=”35px”/></p>

<div class=”text-left” v-if=”resultQuery”>
<div class=”col-md-12 mb-1″ style=”display:inline-block” v-for=”item in resultQuery”>
<h3 v-if=”item.title”>{{ item.title }}</h3>
</div>
</div>
</div>
</template>


About resultQuery data processing:

– If you have not entered the search keyword, the data will display all the values in the datas array which were retrieved (return this.datas).

– When entering search keywords, you can search only by title or multiple arguments (VueJS search filter multiple arguments). Below is the search by title and category, and is not case sensitive.

<script type=”text/javascript”>
export default {
data () {
return {
error: null,
loading: true,
datas: [
{ title:”Add weather and time zone information to your website from free API”, category:”VueJS” },
{ title:”How to import data from excel file, csv into the database and export back”, category:”PHP-MySQL” },
{ title:”PHP – MVC CRUD and Connect to MySQL using PDO”, category:”PHP-MySQL” },
{ title:”Automatically backup MySQL database with Batch file on Windows”, category:”PHP-MySQL” },
{ title:”Add and Remove input textbox with Jquery, Javascript”, category:”Jquery-Javascript” },
{ title:”Customizable multi-type, multi-y axis code ChartJS – Part 2″, category:”Jquery-Javascript” },
{ title:”Customizable multi-type, multi-y axis code ChartJS – Part 1″, category:”Jquery-Javascript” },
];
quickSearch: null,
}
},
computed: {
resultQuery() {
if (this.quickSearch) {
return this.datas.filter((item)=>{
return this.quickSearch.toLowerCase().split(‘ ‘).every(v => item.title.toLowerCase().includes(v) || item.category.toLowerCase().includes(v))
})
} else {
return this.datas;
}
},
}
}
</script>


At this point, we have completed the simple vuejs search filter with the given data.


If you get the data returned by the API, you should use axios to do this.

The beforeRouteEnter and beforeRouteUpdate functions are used to load the priority data as soon as the page is loaded.

<script type=”text/javascript”>
import axios from ‘axios’;
const getData = (page, callback) => {
const params = { page };
axios
.get(‘/api/post’, { params })
.then(response => {
callback(null, response.data);
})
.catch(error => {
callback(error, response);
});
};

export default {
data () {
return {
error: null,
loading: true,
datas: null,
quickSearch: null,
}
},
computed: {
resultQuery() {
if (this.quickSearch) {
return this.datas.filter((item)=>{
return this.quickSearch.toLowerCase().split(‘ ‘).every(v => item.title.toLowerCase().includes(v) || item.category.toLowerCase().includes(v))
})
} else {
return this.datas;
}
},
beforeRouteEnter(to, from, next) {
getData(to.query.page, (err, results) => {
next(vm => vm.setData(err, results));
})
},
beforeRouteUpdate(to, from, next) {
this.loading = true;
this.results = null;
getData(to.query.page, (err, results) => {
this.setData(err, results);
next();
})
},
methods: {
setData(err, {results}) {
this.loading = true;
if (err) {
this.err = err.toString();
} else {
this.loading = false;
this.datas = results;
}
},
}
}
}
</script>


So we have completed the quick search function with multiple parameters using VueJS

You can refer to the results at the home page: https://softdownloadfree.com or site category page https://softdownloadfree.com/category/vuejs/


Thank you for reading the article.

Thứ Ba, 4 tháng 1, 2022

Add weather and time zone information to your website from free API

Today I will introduce to you how to get weather information and display it on your website, get information by available address or by your location.

We will be using a free account from https://home.openweathermap.org, you sign up with an email account and after confirming, you will receive the API from the incoming email. Of course you can create many APIs after logged in.
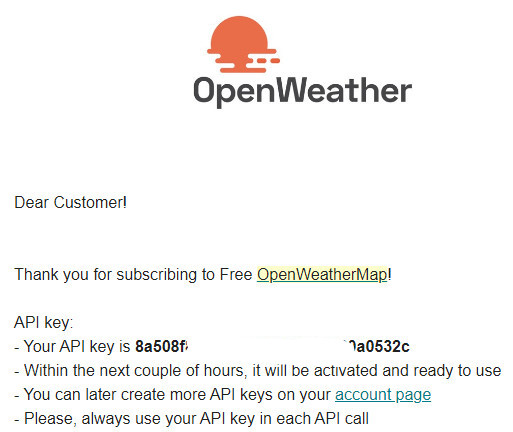
API key from the incoming email
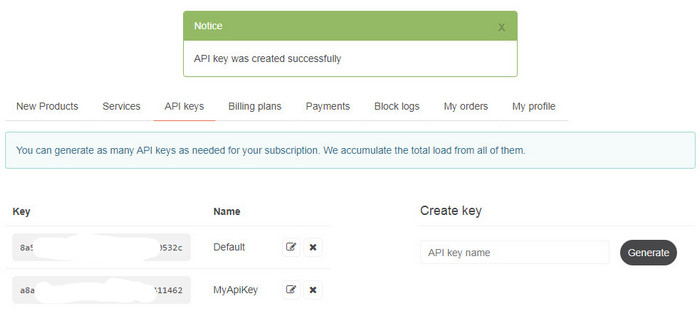
 

Create API key name with name MyApiKey on home.openweathermap.org page


To display a select list of locations for information, you need latitude and longidute addresses. I assume you have list of coordinates of locations as below:


Note: Also you can refer to how to get the coordinates of other locations here Getting Latitude and Longitude from a Click Event

Once you have the information about the API key, the coordinates are needed. We proceed to get data combining Laravel and VueJS as follows:

Of course you only need to use Javascript is also completely applicable.


1. Routes

You create a file routes/api.php

Parameter lat, lng, timezone (purpose to get the current time of the selected coordinate).
Call the IndexController and index function.

Route::get(‘/weather/{lat}/{lng}/{timezone}’, ‘Weathers\IndexController@index’);

2. Controller

Next, you create a file Weathers\IndexController.php

We have List of pre-created time zones and APIKey, connect to API api.openweathermap.org/data/2.5/weather:

namespace App\Http\Controllers\Api\Weathers;

use Carbon\Carbon;
use Illuminate\Http\Request;
use App\Http\Controllers\Controller;

class IndexController extends Controller
{
/**
* Get Weather
*
* @param Request $request
* @param $lat
* @param $lng
* @param $timezone
* @return array
*/
public function index(Request $request, $lat, $lng, $timezone)
{
// By default, it is set GMT 0
date_default_timezone_set(‘UTC’); // default GMT 0

// List of pre-created time zones
$timezoneList = [
‘newyork’ => ‘America/New_York’,
‘tokyo’ => ‘Asia/Tokyo’,
‘shanghai’ => ‘Asia/Shanghai’,
‘london’ => ‘Europe/London’,
‘paris’ => ‘europe/paris’,
‘rome’ => ‘Europe/Rome’,
‘berlin’ => ‘europe/berlin’,
‘singapore’ => ‘asia/singapore’,
‘newdelhi’ => ‘Asia/Kolkata’,
‘bangkok’ => ‘asia/bangkok’,
‘seoul’ => ‘asia/seoul’,
];

if (!empty($timezone) && !empty($timezoneList[$timezone])) {
date_default_timezone_set($timezoneList[$timezone]);
}

// API is taken from openweathermap, you can put this API in ENV file
$APIKey = “YOUR_API_KEY”;
$curl_options = array(
CURLOPT_URL => “http://api.openweathermap.org/data/2.5/weather?lat=$lat&lon=$lng&lang=en&units=metric&APPID=$APIKey”,
CURLOPT_RETURNTRANSFER => true,
CURLOPT_HEADER => false,
CURLOPT_TIMEOUT => 30,
CURLOPT_CONNECTTIMEOUT => 5
);

$curl = curl_init();
curl_setopt_array( $curl, $curl_options );
$result = curl_exec( $curl );

$result = (array) json_decode($result);

// Get time information by selected location
$currentTime = time();
$weekTime = date(“l g:i a”, $currentTime);
$dmy = date(“jS F, Y”, $currentTime);

return [‘result’ => $result, ‘time’ => [‘weekTime’ => $weekTime, ‘dmy’ => $dmy]];
}
}


3. VueJS

Create a file assets/js/views/Home.vue

<template>
<div class=”col-lg-12 text-center”>
<div class=”text-left border-dash” v-if=”weatherResult”>
<div class=”row”>
<div class=”col-lg-2″>
<select class=”form-control select-location” @change=”onChange($event)” v-model=”key” style=”padding: 5px 0;margin: 0;height: auto;”>
<!– List of coordinates is taken first, with additional timezone parameter –>
<option value=”43.000351,-75.499901,newyork”>New York</option>
<option value=”39.916908,116.397057,shanghai”>Beijing</option>
<option value=”31.222219,121.458061,shanghai”>Shanghai</option>
<option value=”28.61282,77.23114,newdelhi”>New Delhi</option>
<option value=”35.689499,139.691711,tokyo”>Tokyo</option>
<option value=”37.583328,127.0,seoul”>Seoul</option>
<option value=”51.512791,-0.09184,london”>London</option>
<option value=”54.033329,10.45,berlin”>Berlin</option>
<option value=”48.853401,2.3486,paris”>Paris</option>
<option value=”41.894741,12.4839,rome”>Rome</option>
<option value=”1.28967,103.850067,singapore”>Singapore</option>
<option value=”13.87719,100.71991,bangkok”>Bangkok</option>
</select>
</div>

<!– Get weather, current time by location –>
<div class=”col-lg-10″>See weather, current time by location
<button v-on:click=”seeYourLocation” class=”btn btn-success” style=”text-transform: inherit;font-weight: normal;”>See weather your location</button>
</div>

<!– Show result –>
<div class=”col-lg-12″ v-if=”weatherResult”>
<b class=”w_name”>{{ weatherResult.name }}: </b>
<span v-if=”weatherTime” class=”w_time”>{{ weatherTime.weekTime }} – {{ weatherTime.dmy }}</span>

<span class=”w_des” v-if=”weatherResult.weather[0].description” style=”text-transform: capitalize;”>{{ weatherResult.weather[0].description }}. </span>

<img :src=”‘https://openweathermap.org/img/w/’ + weatherResult.weather[0].icon + ‘.png'” class=”w_icon” :alt=”Weather” v-if=”weatherResult.weather[0].icon”>
<span class=”w_temp_max” v-if=”weatherResult.main.temp_max”>Max: {{ weatherResult.main.temp_max }}&deg;C. </span>
<span class=”w_temp_min” v-if=”weatherResult.main.temp_min”>Min: {{ weatherResult.main.temp_min }}&deg;C. </span>

<span class=”w_humidity” v-if=”weatherResult.main.humidity”>Humidity: {{ weatherResult.main.humidity }} %. </span>
<span class=”w_wind” v-if=”weatherResult.wind.speed”>Wind: {{ weatherResult.wind.speed }} km/h.</span>
</div>
</div>
</div>
</div>
</template>
<script type=”text/javascript”>
// You can use axios to call the API, but in this article I will not use it
// import axios from ‘axios’;

export default {
data () {
return {
error: null,
weatherResult: ”, weatherTime: ”,
key: ‘43.000351,-75.499901,newyork’, lat: “43.000351”, lng: “-75.499901”, tzone: “newyork”, // The default setting is New York selected
};
},
created() {
// weather
this.weather();
},
methods: {
onChange(event) {
var latLng = event.target.value.split(‘,’);
var lat = latLng[0];
var lng = latLng[1];
var tzone = latLng[2];
this.lat = lat;
this.lng = lng;
this.tzone = tzone;

this.getWeather(this.lat, this.lng, this.tzone);
},

seeYourLocation: function (event) {
var lat = this.lat;
var lng = this.lng;
var tzone = ‘newyork’;
function getLocation() {
if (navigator.geolocation) {
navigator.geolocation.getCurrentPosition(showPosition);
} else {
console.log(“Geolocation is not supported by this browser”);
}
}
function showPosition(position) {
// console.log(“position”, position);
// convert time from timestamp
// console.log(“this.position”, position);
var w_time = new Date(position.timestamp);
lat = position.coords.latitude;
lng = position.coords.longitude;

var api = “/api/weather/” + lat + “/” + lng + “/” + tzone;
axios
.get(api)
.then(response => {
// this.weatherResult = response.data.result;
// this.weatherTime = response.data.time;
var result = response.data.result;

$(‘.w_name’).text(result.name + ‘ : ‘);
$(‘.w_time’).text(w_time);
$(‘.w_temp_max’).text(‘Max: ‘ + result.main.temp_max + ‘°C. ‘);
$(‘.w_temp_min’).text(‘Min: ‘ + result.main.temp_min + ‘°C.’);
$(‘.w_humidity’).text(‘Humidity: ‘ + result.main.humidity + ‘%’);
$(‘.w_wind’).text(‘Wind: ‘ + result.wind.speed + ‘km/h.’);
$(‘.w_des’).text(result.weather[0].description);
$(“.w_icon”).attr(“src”, ‘https://openweathermap.org/img/w/’ + result.weather[0].icon + ‘.png’);

$(‘.select-location’).val(”);
}).catch(error => {
console.log(“error”, error);
});
}
getLocation();
},

weather() {
this.getWeather(this.lat, this.lng, this.tzone);
},

getWeather: function (lat, lng, tzone) {
var api = “/api/weather/” + lat + “/” + lng + “/” + tzone;
axios
.get(api)
.then(response => {
// console.log(“aaa”, response);
var result = response.data.result;
$(‘.w_name’).text(result.name + ‘ : ‘);
$(‘.w_time’).text(response.data.time.weekTime + ‘ – ‘ + response.data.time.dmy);
$(‘.w_temp_max’).text(‘Max: ‘ + result.main.temp_max + ‘°C. ‘);
$(‘.w_temp_min’).text(‘Min: ‘ + result.main.temp_min + ‘°C.’);
$(‘.w_humidity’).text(‘Humidity: ‘ + result.main.humidity + ‘%’);
$(‘.w_wind’).text(‘Wind: ‘ + result.wind.speed + ‘km/h.’);
$(‘.w_des’).text(result.weather[0].description);
$(“.w_icon”).attr(“src”, ‘https://openweathermap.org/img/w/’ + result.weather[0].icon + ‘.png’);

this.weatherResult = response.data.result;
this.weatherTime = response.data.time;

$(‘.select-location’).val(”);

}).catch(error => {
console.log(“error”, error);
});
}
}
}
</script>


4. Run webpack

Run watch to test

npm run watch

When you select a place from the list, the results will be displayed automatically. When you want to see information in your area, select [See weather your location] to get the results.
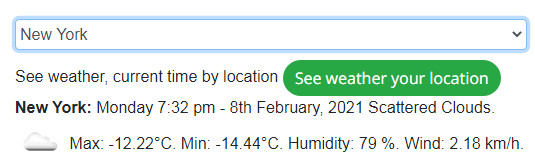
 

Weather information, time in New York

5. Conclusion

In the above simple example we have got the weather, temperature, time information of the selected coordinates, you can simply javascript and html to get the result like above.


Thanks for reading the article.

Chủ Nhật, 12 tháng 12, 2021

Add and Remove input textbox with Jquery, Javascript

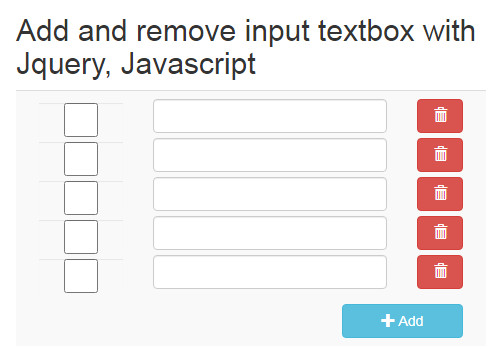
Hello everyone, to continue the series of articles about Jquery and Javascript, in this article I introduce you to the small code about adding and removing form elements using Javascript, with specific example is input textbox.

On the same screen, you can add and remove elements including textboxes and checkboxes without reloading the page. By naming the element an array, the final result when the action post the PHP form will get the value of all selected elements.

add-and-remove-input-box-jquery-javascript

Add and remove input textbox with Jquery, Javascript


1. Library

We only need Jquery and Bootstrap’s css (here we use bootstrap 3.3.6)

“https://code.jquery.com/jquery-3.5.1.min.js”
“https://maxcdn.bootstrapcdn.com/bootstrap/3.3.6/css/bootstrap.min.css”

2. HTML

Use tables to show the elements added and remove

// Code php in the download file

3. CSS

.container {
width: 500px;
margin: 0 auto;
}
.add_item{
float: right;
}
.btn_add_item{
margin-top: 10px;
}

4. PHP set default

// Data received from Database
// Default input element is 5
$data_program_names = [];
$number_input_default = 5;

5. Javacript

// Add event
$(‘.btn_add_item’).on(‘click’, function () {
// code in the download file…
});

// Delete event
$(document).on(‘click’, ‘.btn_delete_item’, function (e) {
let item_id = $(this).data(‘delete_id’);
$(‘.item_id_’ + item_id).remove();
});

When removing the element, you must put it in the $ (document) tag for it to work.

If only write:

$(‘.btn_delete_item’).on(‘click’, function () {})

then will not work because it is in the processing area of the Javascript add script.


Download file code, just one php file: Download full code Size: 4 KB


So we have completed the example of Add and Remove input textbox with Jquery and Javascript.


Thank you for reading this article.

Thứ Tư, 24 tháng 11, 2021

Customizable multi-type, multi-y axis code ChartJS – Part 2

 Following the part code of ChartJS 2.x, after part 1 of ChartJS, we discussed the multi-line display of the chart. We continue to present to you some ChartJS modifications that may be required for your requirements in part 2 of this article will edit some more interesting options.

In addition to the multi lines, we will have multi y axes, which is a very important property when you want to display multiple lines with different data indicators on the same chart.

Highlights in this post:

– Show multiple yAxis columns, corresponding color annotation.

– Connect the 2 point line with data or 2 adjacent points.

– Ignoring the empty point or not ignore the empty point.

– Show and hide the lines with one click.


code-chartjs-connect-the-2-point-ignore-null-point

Connect the 2 point line with data and Ignoring the empty point.


code-chartjs-connect-the-2-point-not-ignore-null-point

Connect the 2 adjacent points and not ignore the empty point.


code-chartjs-hide-the-lines-with-one-click

Show and hide the lines with one click head label.


1. HTML tag to display Chart

<div class=”chart-container” style=”position: relative; height:auto; width:50%; margin:0 auto”>
<canvas id=”myChart” width=”900″ height=”300″></canvas>
</div>


2. Set default data retrieved from database

$data_source = [
“labels” => [‘2020-01’, ‘2020-02’, ‘2020-03’, ‘2020-04’, ‘2020-05’],
“el1” => [‘1’, ‘3’, null, null, ‘2’],
“el2” => [’11’, null, ’22’, ‘null’, ’33’],
“el3” => [’14’, ’25’, ’26’, ’30’, ’33’]
];


3. CSS

<style>
canvas{
-moz-user-select: none;
-webkit-user-select: none;
-ms-user-select: none;
}
</style>


4. Load library ChartJS

<script src=”assets/chartjs/2.13.0moment.min.js”></script>
<script src=”assets/chartjs/2.8.0Chart.min.js”></script>
<script src=”assets/chartjs/utils.js”></script>

5. Show Chart with data

<script>
var datas = <?php echo json_encode($data_source); ?>;
var ctx = document.getElementById(‘myChart’);
var myChart = new Chart(ctx, {
type: ‘line’,
data: {
labels: datas[“labels”],
datasets: [
{
label: ‘Label1’,
borderColor: window.chartColors.blue,
borderWidth: 2,
fill: false,
data: datas[“el1”],
borderColor : “red”,
backgroundColor : “red”,
lineTension: 0, // strainghtlines
yAxisID: ‘Label1’,
},
{
label: ‘Label2’,
borderColor: window.chartColors.blue,
borderWidth: 2,
fill: false,
data: datas[“el2”],
borderColor : “blue”,
backgroundColor : “blue”,
lineTension: 0, // straightlines
yAxisID: ‘Label2’
},
{
label: ‘Label3’,
borderColor: window.chartColors.blue,
borderWidth: 2,
fill: false,
data: datas[“el3”],
borderColor : “#a9a518”,
backgroundColor : “#a9a518”,
lineTension: 0,
yAxisID: ‘Label3’
},
]
},
options: {
responsive: true,
title: {
display: true,
text: ‘Label’
},
tooltips: {
mode: ‘index’,
intersect: true
},
annotation: {
annotations: [
{
type: ‘line’,
mode: ‘horizontal’,
scaleID: ‘y-axis-0’,
value: 5,
borderColor: ‘rgb(75, 192, 192)’,
borderWidth: 4,
label: {
enabled: false,
content: ‘Label’
}
}
]
},
scales: {
yAxes: [
// {
//     ticks: {
//         beginAtZero: true // Common set all: set start y column = 0
//     }
// },
{
id: ‘Label3’,
type: ‘linear’,
position: ‘left’,
ticks: {
min: 0,
fontColor: “#a9a518”, // color of yAxes
},
},
{
id: ‘Label2’,
type: ‘linear’,
position: ‘left’,
ticks: {
min: 0,
fontColor: “blue”, // color of yAxes
},
},
{
id: ‘Label1’,
type: ‘linear’,
position: ‘left’,
ticks: {
min: 0,
fontColor: “red”, // color of yAxes
},
},
]
},
// true: connect the 2 point line, ignoring the empty point
// false: connect 2 adjacent points, do not ignore the empty point
spanGaps: false
}
});
</script>


Download full code at here:


Thứ Năm, 18 tháng 11, 2021

Code Chart JS with multi type – Part 1

We all know how powerful ChartJS 2.x is when it comes to chart rendering, and in some cases ChartJS is more robust when compared to Google Chart. In this content, we will talk about multi-type show in ChartJS.

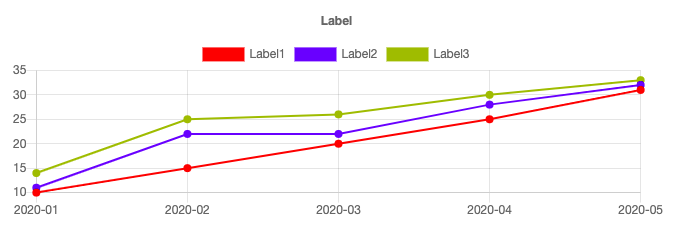
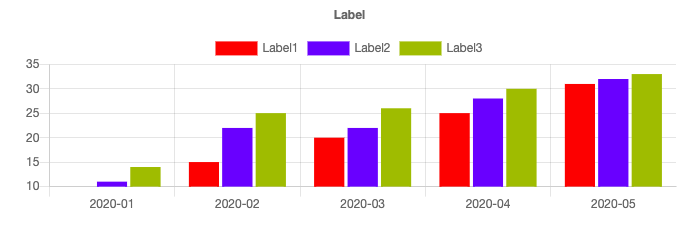
Assuming you are using PHP server, we need json_encode to show in JS. In addition to the line chart, you can set up in the form of bar, radar, …

Line chart

Bar chart


1. Html tag to show chart:

<div class=”chart-container” style=”position: relative; height:auto; width:50%; margin:0 auto”>
<canvas id=”myChart” width=”900″ height=”300″></canvas>
</div>

– Set default data_source get from php:

$data_source = [
“labels” => [
‘2020-01’,
‘2020-02’,
‘2020-03’,
‘2020-04’,
‘2020-05′,
],
“el1” => [
’10’, ’15’, ’20’, ’25’, ’31’
],
“el2” => [
’11’, ’22’, ’22’, ’28’, ’32’
],
“el3” => [
’14’, ’25’, ’26’, ’30’, ’33’
]
];


2. Css:

<style>
canvas{
-moz-user-select: none;
-webkit-user-select: none;
-ms-user-select: none;
}
</style>


3. JS library

<!– // start chartjs  –>
<script src=”assets/chartjs/2.13.0moment.min.js”></script>
<script src=”assets/chartjs/2.8.0Chart.min.js”></script>
<script src=”assets/chartjs/utils.js”></script>

4. Map js code to show the chart

var datas = <?php echo json_encode($data_source); ?>;
var ctx = document.getElementById(‘myChart’);
var myChart = new Chart(ctx, {
type: ‘line’,
data: {
labels: datas[“labels”],
datasets: [
{
label: ‘Label1’,
borderColor: window.chartColors.blue,
borderWidth: 2,
fill: false,
data: datas[“el1”],
borderColor : “red”,
backgroundColor : “red”,
lineTension: 0, // strainghtlines
},
{
label: ‘Label2’,
borderColor: window.chartColors.blue,
borderWidth: 2,
fill: false,
data: datas[“el2”],
borderColor : “blue”,
backgroundColor : “blue”,
lineTension: 0, // straightlines
},
{
label: ‘Label3’,
borderColor: window.chartColors.blue,
borderWidth: 2,
fill: false,
data: datas[“el3”],
borderColor : “#a9a518”,
backgroundColor : “#a9a518”,
lineTension: 0,
},

]
},
options: {
responsive: true,
title: {
display: true,
text: ‘Label’
},
tooltips: {
mode: ‘index’,
intersect: true
},
annotation: {
annotations: [
{
type: ‘line’,
mode: ‘horizontal’,
scaleID: ‘y-axis-0’,
value: 5,
borderColor: ‘rgb(75, 192, 192)’,
borderWidth: 4,
label: {
enabled: false,
content: ‘Label’
}
}
]
}
}
});


Download full code at here

Download full code

Size: 119 KB


Readmore: Customizable multi-type, multi-y axis code ChartJS – Part 2